Juniper VMX Trial and Error
I have spent some time scratching my head on ESXi-based VMX and I thought I would share some experience. This isn’t meant to be a guide, or replace Juniper’s own docs, but to supplement (and help me remember stuff 2 years later).
My setup:
Dell server, 10 Core Xeon E5-2640 (20 thread), 48GB RAM, ESXi 6.5
I have deployed the OVAs from Juniper for VMX 17.4R1.16.
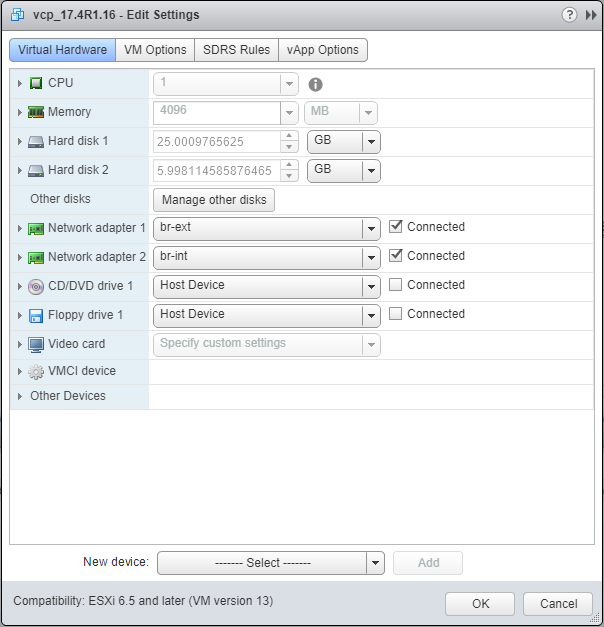
vCP: 1CPU, 4GB ram, 2x e1000 NIC (br-ext and br-int port groups)
vFCP: 14 CPU, 16 GB RAM, 2x e1000 NIC (br-ext and br-int) plus 2x e1000 NIC (to be my ge-0/0/0 and ge-0/0/1)
The br-ext port group is just on an existing DHCP enabled vSwitch, and I can SSH into the VMX components fine. It seems that in Junos 17.4, the vFPC also gets a DHCP address for its ext bridge interface, which is nice.
The br-int port group is on its own dedicated vSwitch. All my vSwitches have MTU 9000, all security options enabled (promiscuous mode, mac forging etc.. All on).
My two ‘WAN’ interfaces, which are vNIC 3 and 4 under ESXi are there to prove things are working (I have a Linux VM attached to each, via a dedicated vSwitch/port group each). I run simple iperf tests across them, no routing protocols involved at this stage. In this lab/test I am using no physical NIC, so there is no bottleneck - nor is this a particularly realistic test for the real world deployment of VMX.
My topology is:
VM1 — VMX — VM2

Confusingly for you, my VM1 and VM2 are actually called Bird and Space Host. Don’t ask. Again, I am using a vSwitch as a cable between VM and VMX, with no physical cabling required. The br-ext link connects vCP, vFPC and an external network for management.
Lite-mode Vs Performance mode:
By default, VMX runs in performance mode. I find on ESXi (due to dpdk polling), that performance mode absolutely kills my allocated CPU threads. My ESXi reports running around 95% CPU load when a performance mode FPC is sitting idle. I find this has a major impact on TCP throughput, as well as making the ESXi box hopeless for doing other tasks. I am not a kernel expert, so I don’t really understand the implications of this CPU load.. I will leave it alone.
The real issue I had with VMX was before I even got off the ground. I was using the vFPC with 4 NIC (2 for bridges, 2 for ge- ports). By default, I assigned e1000 virtio NICs to the VM. This ended with me being stuck in ‘Present Absent’, which is what ‘show chassis fpc’ would show me for FPC 0. By default, you are in performance mode - and that doesn’t like e1000 NICs. Change the two “ge-“ interfaces, in my case vmnic3 and vmnic4 to ‘VMXNET3’ and it fires up and starts passing packets. This appears to be a bug specific to Junos 17.4R1 - according to a phone-call I had with JTAC.
As I have 1Gbit/s licenses for the VMX, lite-mode is fine.
Detailed ESXi Setup
One of the things I find painful with VMX is the quality of the documentation, particularly for VMWare. Juniper releases OVAs for this platform, but shrinks away from documenting the nuts and bolts sufficiently.
Starting with the vCP OVA:
 <figcaption id="caption-attachment-212" class="wp-caption-text">VMWare details of vCP VM</figcaption></figure>
I’ve set the machine to have 1 CPU, 4GB of RAM and I’m using two port-groups for the NICs, br-ext and br-int, as described earlier in this post.
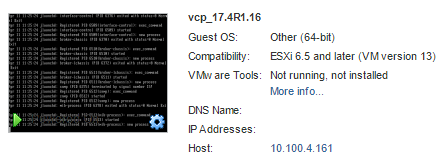
I also upgraded the VM hardware version to 13 (the OVA comes as version 10). This was based on a blog post I read in the middle of the night. I wish I could say why this mattered (JTAC suggested this only improves things when using KVM-based VMX and SR-IOV, but hey).
 <figcaption id="caption-attachment-213" class="wp-caption-text">Summary of vCP</figcaption></figure>
Now onto the vFPC VM:
 <figcaption id="caption-attachment-214" class="wp-caption-text">VMWare details of vFPC VM</figcaption></figure>
As you can see in the screenshot, I have set the 16GB of memory to be reserved. This helped with performance, particularly of my testing VMs running on the same host. I have also expanded one of my ‘WAN’ interfaces to show that it’s an E1000 NIC connecting to one of my Linux hosts.
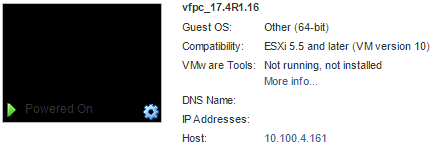
The VM hardware version of my working vFPC is version 10.
 <figcaption id="caption-attachment-215" class="wp-caption-text">Summary of vFPC</figcaption></figure>
It’s best to set up all of this hardware in advance of switching either of the VMs on. Once you do, your vFPC should pull down a DHCP address from your br-ext bridge (mine is set up as a port group on my vSwitch0, which also shares kernel management for the ESXi itself). The vCP won’t get a DHCP address by default, as that’s not supported on fxp interfaces. I configure mine via the ESXi console.
Is it working?
Once you’ve booted both VMs, you will need to give them about 4-5 minutes. From my own bashing around in the log files, it seems that the vFPC pulls down some config from the vCP and then starts up RIOT, the process which is meant to emulate the MX series’ Trio chipset.
Note - under 17.4R1.16, the vFPC won’t work correctly by default (we set our interfaces to e1000) - so you will need to do the following to enable lite-mode, from the vCP CLU (login as root, no password. Then enter ‘cli’)
james@ch-vmx-1> edit private
[edit]
james@ch-vmx-1# set chassis fpc 0 lite-mode
james@ch-vmx-1# commit and-quit

james@ch-vmx-1> request system reboot [Y]
This (plus a reboot of the vFPC VM for good measure) will put you into lite-mode. Once this reboot (~5mins) process has finished, you can check 2 important things from the vCP CLI. First, check the chassis hardware and see if we’re in lite-mode for real:
james@ch-vmx-1> show chassis hardware
Hardware inventory:
Item             Version  Part number  Serial number     Description
Chassis                                VM5ACC9ED832      VMX
Midplane
Routing Engine 0                                         RE-VMX
CB 0                                                     VMX SCB
FPC 0                                                    Virtual FPC
  CPU            Rev. 1.0 RIOT-LITE    BUILTIN
  MIC 0                                                  Virtual
    PIC 0                 BUILTIN      BUILTIN           Virtual
From here, you can see FPC 0’s CPU is listed as RIOT-LITE. That’s what we wanna see.
Next, you can check the status of the FPC itself:
james@ch-vmx-1> show chassis fpc 0
                     Temp  CPU Utilization (%)   CPU Utilization (%)  Memory    Utilization (%)
Slot State            (C)  Total  Interrupt      1min   5min   15min  DRAM (MB) Heap     Buffer
  0  Online           Testing   4         0        3      4      4    2047        7          0
This garbled-by-my-wordpress-theme output shows the FPC in slot 0 is up and running. The temperatire will never move on from ‘testing’ as it’s not a real probe (but it is on a real Trio-based FPC!)
To test the performance (another post on that one day, perhaps) - I fire some packets from VM1 to VM2. They rely on the VMX to do the routing, as they are in different subnets. I’m using some quite expensive hardware/software here to send a few packets around a pretend network - but it proves the thing works:
[client - sender]
james@VM1:~$ iperf -c 172.16.200.1 -i 1
------------------------------------------------------------
Client connecting to 172.16.200.1, TCP port 5001
TCP window size:  325 KByte (default)
------------------------------------------------------------
[  3] local 172.16.200.5 port 49127 connected with 172.16.200.1
[ ID] Interval       Transfer     Bandwidth
[  3]  0.0- 1.0 sec   128 MBytes  1.08 Gbits/sec
[  3]  1.0- 2.0 sec   119 MBytes   997 Mbits/sec
[  3]  2.0- 3.0 sec   118 MBytes   992 Mbits/sec
[  3]  3.0- 4.0 sec   118 MBytes   988 Mbits/sec
[  3]  4.0- 5.0 sec   119 MBytes   996 Mbits/sec
[  3]  5.0- 6.0 sec   118 MBytes   992 Mbits/sec
[  3]  6.0- 7.0 sec   118 MBytes   994 Mbits/sec
[  3]  7.0- 8.0 sec   118 MBytes   993 Mbits/sec
[  3]  8.0- 9.0 sec   119 MBytes   995 Mbits/sec
[  3]  9.0-10.0 sec   118 MBytes   991 Mbits/sec
[  3]  0.0-10.0 sec  1.17 GBytes  1.00 Gbits/sec
[server - receiver]
james@VM2:~$ iperf -s -i 1
------------------------------------------------------------
Server listening on TCP port 5001
TCP window size: 85.3 KByte (default)
------------------------------------------------------------
[  4] local 172.16.200.1 port 5001 connected with 172.16.200.5
[ ID] Interval       Transfer     Bandwidth
[  4]  0.0- 1.0 sec   127 MBytes  1.06 Gbits/sec
[  4]  1.0- 2.0 sec   119 MBytes   996 Mbits/sec
[  4]  2.0- 3.0 sec   118 MBytes   991 Mbits/sec
[  4]  3.0- 4.0 sec   118 MBytes   990 Mbits/sec
[  4]  4.0- 5.0 sec   118 MBytes   994 Mbits/sec
[  4]  5.0- 6.0 sec   118 MBytes   992 Mbits/sec
[  4]  6.0- 7.0 sec   118 MBytes   993 Mbits/sec
[  4]  7.0- 8.0 sec   119 MBytes   995 Mbits/sec
[  4]  8.0- 9.0 sec   118 MBytes   993 Mbits/sec
[  4]  9.0-10.0 sec   118 MBytes   991 Mbits/sec
[  4]  0.0-10.0 sec  1.17 GBytes   999 Mbits/sec
So there we go, a VMX in lite-mode, throwing 1Gbit/s of iperf traffic around.
Things that might be going wrong
Getting to this stage took me a while, so here are some things you might be finding are going wrong trying to use ESXi and VMX together.
1- Can’t access vFPC
This might be caused by a fairly random problem I’ve seen in 17.4R1 where 2 of the 3 NICs that the vFPC automatically stands up don’t show. You will be left with ‘int’ only. Console into the vFPC and have a look (root/root will get you in):
root@localhost:~# ifconfig| grep Link
ext       Link encap:Ethernet  HWaddr 00:50:56:9f:94:8b
int       Link encap:Ethernet  HWaddr 00:50:56:9f:03:28
lo        Link encap:Local Loopback
That shows 3, so in my case it’s working as you’d hope
2 - Throughput sucks
Check your VMX license is applied. Even the trial license is good enough for most lab cases.
james@ch-vmx-1> show system license
License usage:
                                 Licenses     Licenses    Licenses    Expiry
  Feature name                       used    installed      needed
  scale-subscriber                      0           10           0    permanent
  scale-l2tp                            0         1000           0    permanent
  scale-mobile-ip                       0         1000           0    permanent
  VMX-BANDWIDTH                         0         1000           0    permanent
  VMX-SCALE                             1            1           0    permanent

Licenses installed:
  License identifier: xxxx
  License version: 4
  Software Serial Number: xxxx
  Customer ID: xxxx.
  Features:
    vmx-bandwidth-1g - vmx-bandwidth-1g
      permanent
    vmx-feature-base - vmx-feature-base
      permanent
You can see here I have a 1000Mbit license for bandwidth. Go me.
If you have a license applied and throughput still sucks, you might have a resource problem or some other issue. These can maybe be discussed in the comments below, but you might do better running up a thread in the Juniper official VMX support forum. Good luck!